Cloudfishes
First steps with Payara Cloud

The Hydrolycus scomberoides, also called Payara in English, is a South American predatory fish native to the Orinoco and Amazon basins. But this article is not about zoology, but about the fish’s namesake: the Payara Application Server.
The Payara Server is based on the JEE reference implementation GlassFish, which is now maintained by the Eclipse Foundation. Like GlassFish, the server itself is open source, but Payara Service Ltd provides additional commercial support and other services. The Payara server supports both Jakarta EE and the Eclipse Microprofile standard.
Payara Cloud
Already at the end of 2020, Payara Services announced in a blog article that the Payara Server will also be offered as a cloud service. Essentially, the idea is to provide a virtual application server where you only have to upload your artifact as WAR file and you can start right away. I found this exciting and therefore decided to keep an eye on the topic.
As already described in my (german) article “Serverless Java”, this approach is quite close to the original J(2)EE concept, where the application server is completely transparent to the developer, and it fits wonderfully with the new cloud-based serverless services. Payara Cloud is thus a “serverless server”, so to speak, where all the complexity of Kubernetes (with which Payara Cloud is implemented) is hidden from the user.
Unfortunately, it took until this summer until Payara provided a test access. I was kindly given a 14-day preview account. I couldn’t spare too much time, but I wanted to have a quick look around in any case.
Here is a short summary of my impressions:
Deployment
When you log in to the test environment, you will see a clean interface where you can find the available subscription.
First you have to set up a namespace. For this, you only have to assign a project or application name, an environment name (e.g. DEV, TEST, etc.) and select an Azure region (for the test, only “East US” and “West Europe” were available). Within a namespace, you can then upload multiple artifacts — e.g. to deploy multiple micro services — all running on their own application server.

Once a namespace is created, we get to the most exciting part. Now it’s time to upload the deployment artifact. In my case, this is a WAR file that contains a simple JAX-RS resource that responds with a kind of “Hello world” plus timestamp.

In the dialog, you select the file and can overwrite the application name, otherwise it is taken from the artifact name. If you check the box “Deploy Immediately”, the deployment will start immediately after the upload.
My first attempt still failed, but that was only because my code still had a compile error. As soon as this was corrected, the application deployed and the service could be called successfully via the displayed address:

That’s it! The application is deployed and ready to run.
Configuration and Logs
It does not need many additional settings. However, you can change the configuration in some ways. Mainly you can choose different CPU sizes and change the context root. I had to do the latter when I uploaded the same WAR again with a different application name in the same namespace.

In this configuration dialog, the values of a deployed persistence.xml would also show up — at least that’s how I understood the statement in a video by Payara.
Of course you can view the logs but also download them (in a JSON format). Here, however, I only got the logs displayed on the namespace level, but not on the application level. Either I was too stupid or there is still a bug in the implementation.

Dashboards
On the application level as well as on the namespace level you can see dashboards with log entries, http requests and memory history. However, these charts were again only displayed with values at the namespace level.

Other Functions
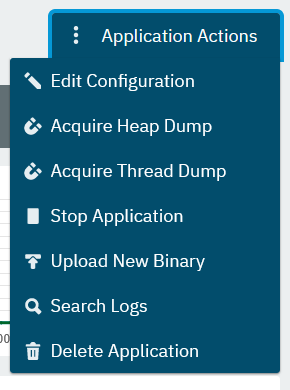
As already mentioned, the logs can also be exported and thread or heap dumps of the running application can be pulled. Per namespace, an external domain name can also be linked, so that the generated subdomains of Payara do not have to be used.
Most of the functions can be called via various action buttons:

Conclusion
It is remarkable how quickly you can get a simple application deployed and running. This is where the Payara Cloud concept has its great strength. I haven’t read anything about it yet, but for sure an API is planned to avoid having to deploy manually on a regular basis.
In practice, an application usually has some dependencies on other services such as databases and the like. It is currently not clear to me how such resources can be made available within the Payara Cloud, especially if they are not publicly accessible services. The monitoring options are also quite rudimentary at the moment. However, the Payara team is certainly already busy expanding the functionality here.
All in all, it’s a promising start and I’m curious to see how the Payara Cloud develops in the future.
